REGIONAL PLANNING AND TRANSPORTATION
REGIONAL PLANNING
Collaboration between:
Spurred by state initiatives, in 2013 MTC and ABAG will adopt a long range (25-year) cumulative transportation and land-use strategy or the San Francisco Bay Area (101 cities and towns) called Plan Bay Area [4]. Pairing of these main concerns is aimed at producing a Sustainable Communities Strategy. The new plan is based off previous guidelines according to the One Bay Area plan from April 2010 [5] and the Transportation 2035 MTC goals [6]. MTC provides the Bay Area Regional Transportation Plan, updated every four years. Additionally, ABAG provides demographic and economic statistics on a bi-annual basis [7]. Plan Bay Area is aimed at accommodating a sizeable population increase from approximately 7 million (2011) to 9 million (2040).
- Metropolitan Transportation Commission (MTC) - 9 county San Francisco Bay Area [1]
- Association of Bay Area Government (ABAG) [2]
- California Department of Transportation (Caltrans) [3]
Spurred by state initiatives, in 2013 MTC and ABAG will adopt a long range (25-year) cumulative transportation and land-use strategy or the San Francisco Bay Area (101 cities and towns) called Plan Bay Area [4]. Pairing of these main concerns is aimed at producing a Sustainable Communities Strategy. The new plan is based off previous guidelines according to the One Bay Area plan from April 2010 [5] and the Transportation 2035 MTC goals [6]. MTC provides the Bay Area Regional Transportation Plan, updated every four years. Additionally, ABAG provides demographic and economic statistics on a bi-annual basis [7]. Plan Bay Area is aimed at accommodating a sizeable population increase from approximately 7 million (2011) to 9 million (2040).
REGIONAL TRANSPORTATION
Bay Bridge
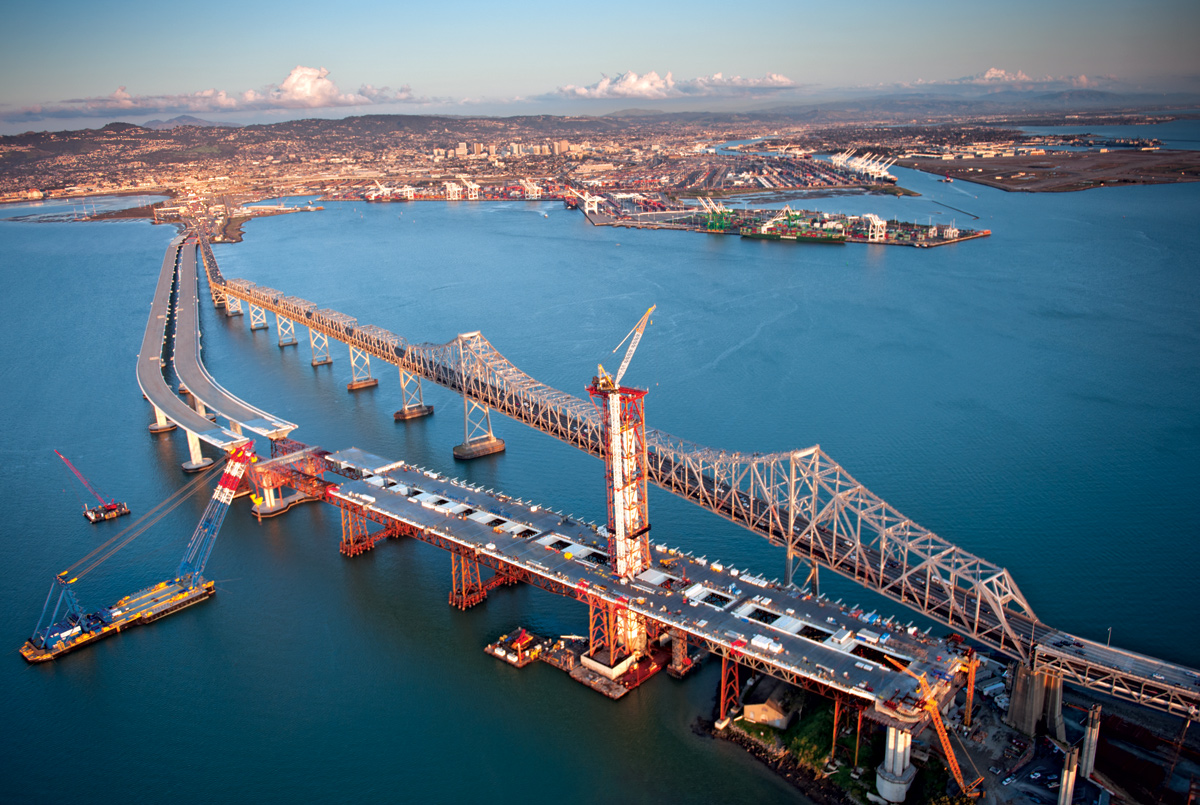
Figure 1: Existing Bay Bridge and New Addition.
Opened November 12, 1936, the Bay Bridge connects the East Bay (through Oakland) and San Francisco. 2011 marked the structure’s 75th anniversary. In 2002, construction began on the new Bay Bridge, the world’s longest Self-Anchored Suspension Span (SAS). Reinforcing the West Span and entirely replacing the East Span is estimated to cost $6.3 billion dollars, qualifying as one of the U.S.’s largest public projects ever. The completed renovation is scheduled to open in 2013. Management of the bridge is collaborative between Caltrans, the Bay Area Toll Authority, and California Transportation Commission. See the Bay Bridge Timeline for more info: [8]
|
|
For more on The Bay Lights see: Local Charm
|
Port of Oakland
The Port of Oakland receives no tax money from the city, and provides millions in revenue. It’s sustainability policy, known as the “Three E’s,” focuses on Environmental responsibility, Economic vitality and social Equity. [9]
Maritime
Established in 1927, Oakland’s port is the third largest on the West Coast, and the fifth largest in the United States. Because of Oakland’s well developed local air, rail and road freight networks, shipping time (from Asian markets) can be cut by 24 hours compared to Southern California. The Port provides 465 local jobs and thousands more locally. Shipping involves both public and private activity. It is governed by the “Board of Port Commissioners, nominated by the mayor of Oakland and appointed by a vote of the City Council.” [10]
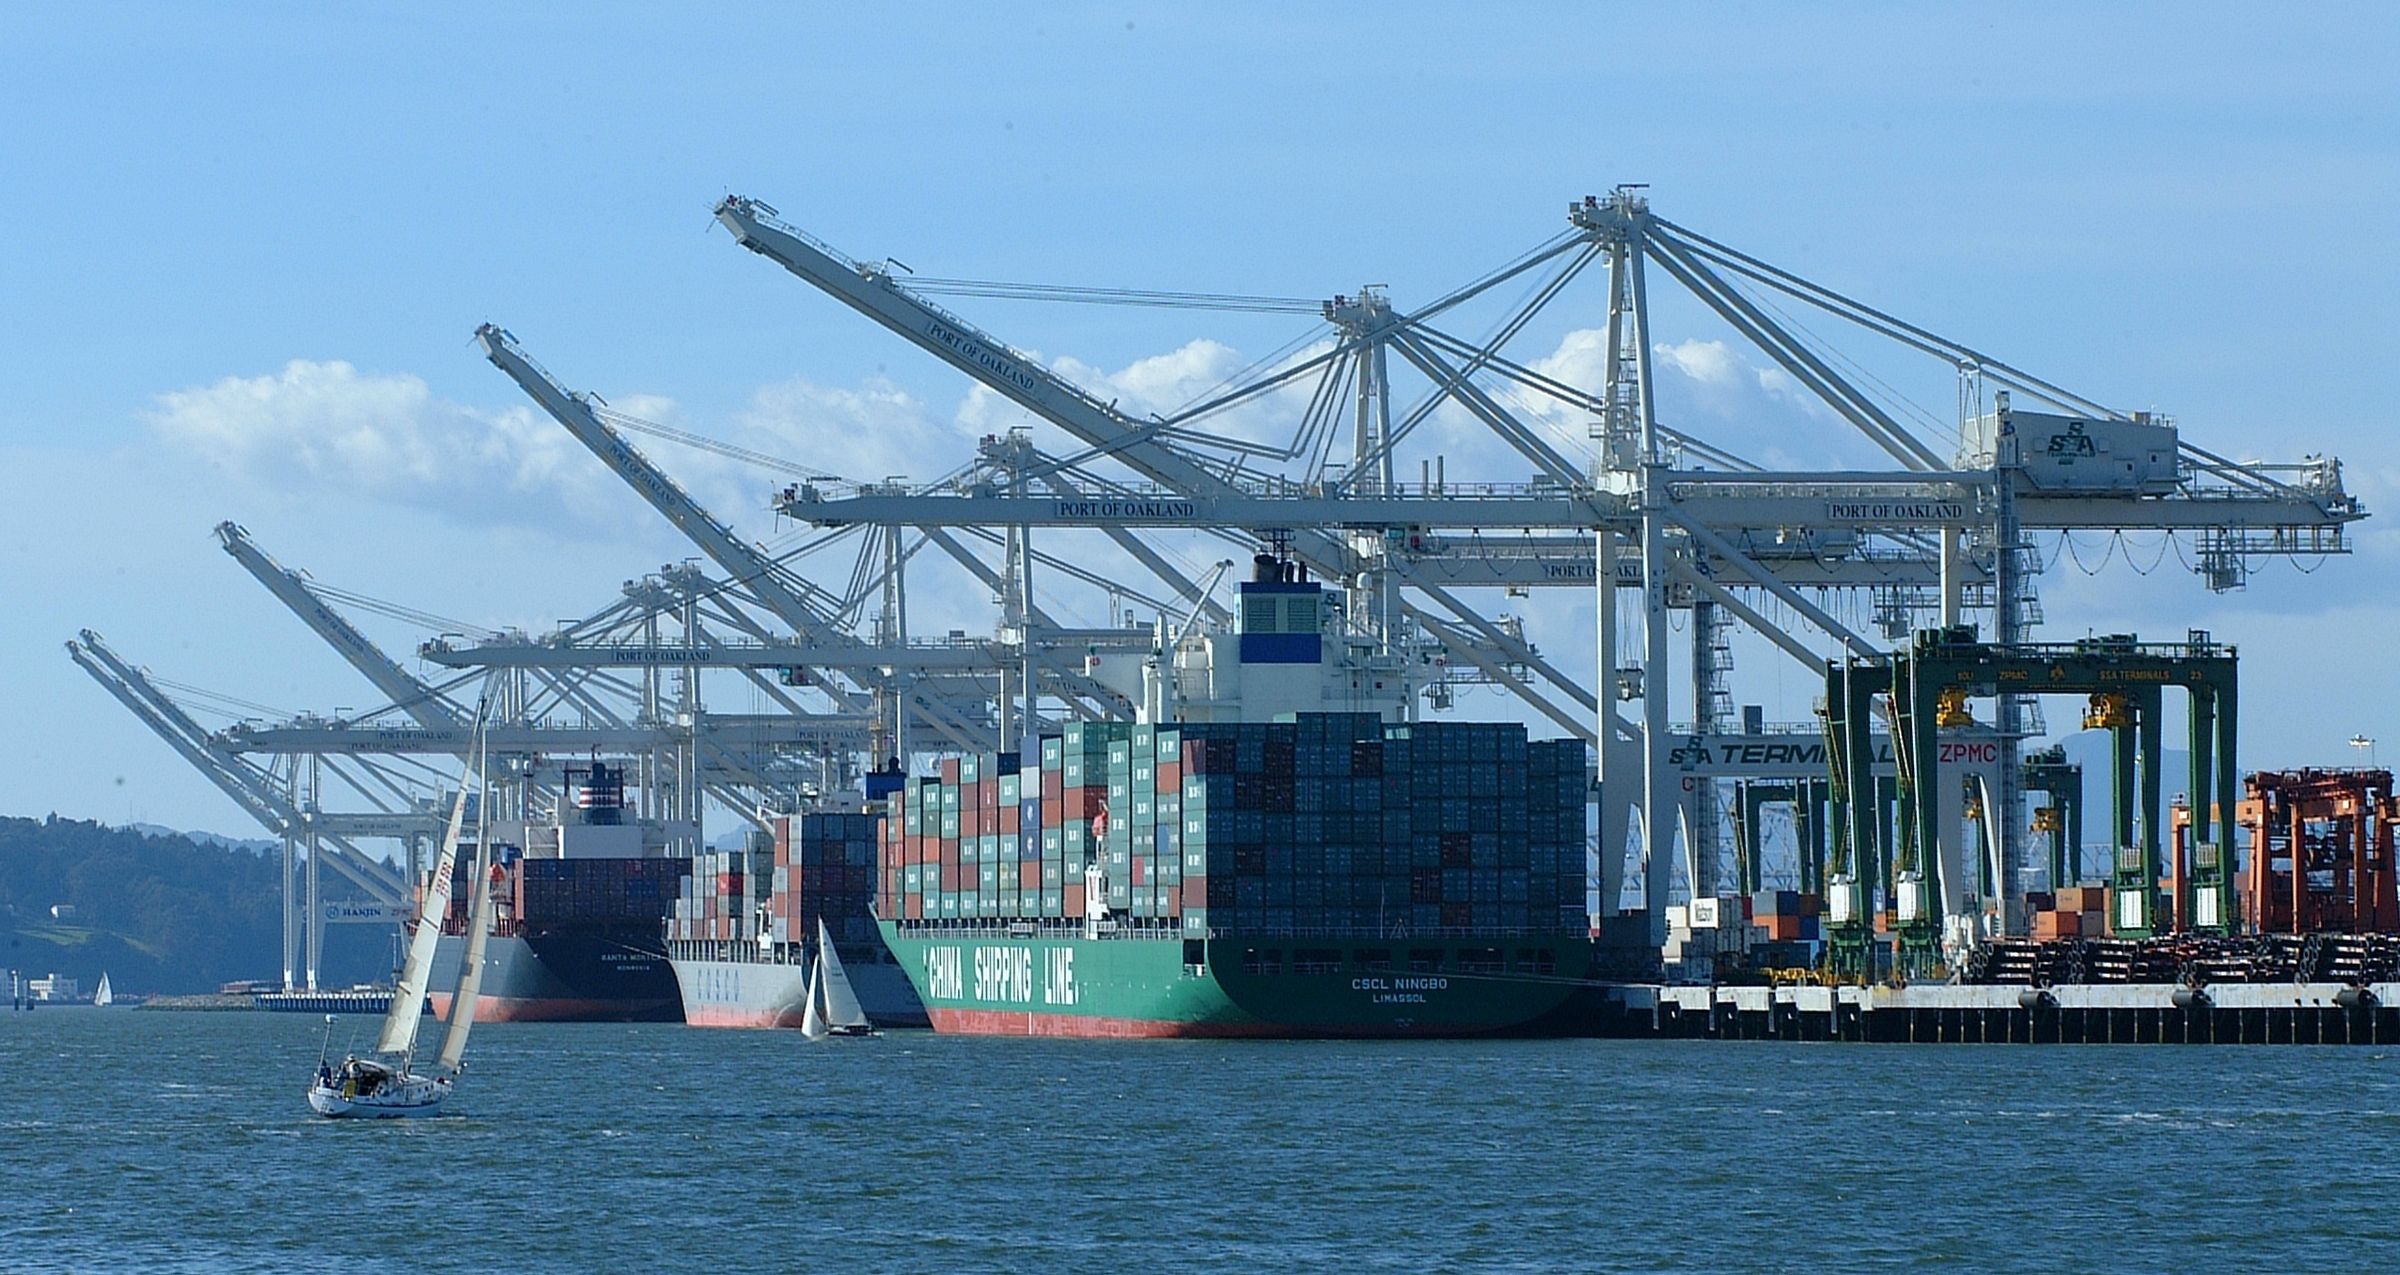
Figure 2: Port of Oakland
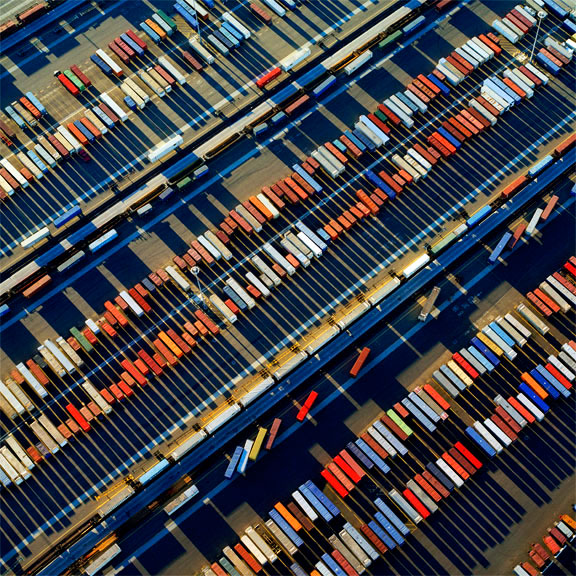
Figure 3: Port of Oakland, Container Parking.
Airport
Oakland International Airport falls under the overarching designation “Port of Oakland” and has served the region since 1927 (as an airfield). In 1962, Terminal 1 was built for jets, with 16 gates and a 10,000 foot runway. In 1985, Terminal 2 was built exclusively for Southwest Airlines. In 2008, a $300 million Terminal Improvement Program added a 5 more gates.
The original project was designed for 8 million passengers annually, but in 2005 OAK served 14.4 million. The Airport Development Plan (ADP) [11] is designed to accommodate increasing demand and improve convenience and reliability. This differs from the 20-year Master Plan [12] completed in 2006. The site is well situated near the junction of Interstates 880 and 580, which are connected to Interstate 80 (transcontinental highway) and 5 (N-S Southern California connection).
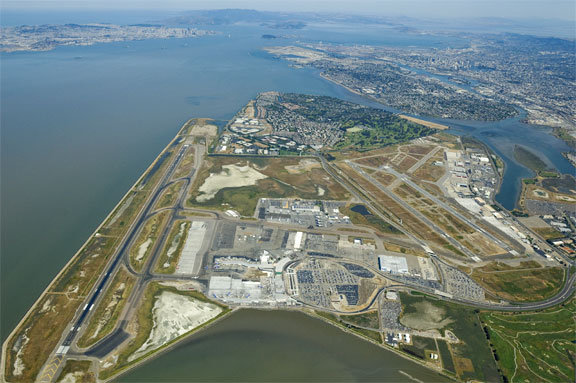
Figure 4: Aerial View of Oakland International Airport (OAK)
BART: Bay Area Transit
Local train – Slogan: “BART … and you’re there”
Beginning around 1946 (following WWII and heavy emigration to the Bay Area) there was a large increase in the number of cars on the road, especially the bridges spanning the bay. In 1951 the State created the San Francisco Bay Area Rapid Transit Commission. It was actually this venture that brought about initial cohesiveness in Bay Area Planning, since no comprehensive future development plan existed for its use. Aside from expected construction costs, the legal process inherent to implementing such a large new transit system also added to the project’s overall budget for a total original system cost of $1,619,000,000.
There are 44 unique stations, constructed specifically to fit the surrounding area. Differing from normal trains or subway systems with homogeneous stations, BART has 16 surface, 13 elevated and 15 subway stations (tracks are also surface, areal and tunnel). Additionally, 4 downtown San Francisco stations are connected to the city’s MUNI metro train, and the Millbrae station is connected to Caltrain. The destinations are split along the A-line from Fremont to Lake Merritt, M-, W- and Y- line from West Oakland to Millbrae, the R line from Richmond to MacArthur, the C-line from Pittsburg/Bay Point to Rockridge, and the L-line from Dublin/Pleasanton to Bay Fair. The average speed of a train is 33mph and the stations cover 104 miles.
In 2012, BART celebrated its 40th anniversary (1972-2012) [13]
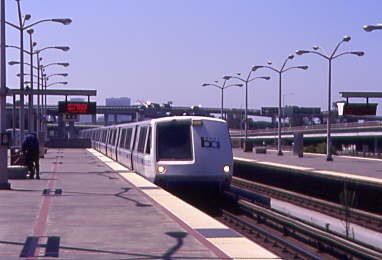
Figure 5: MacArthur Station (Oakland).
AMTRAK
Regional Train- National Railroad Passenger Corporation [14]
CA has the highest Amtrak usage of any state in the country. Oakland is in the top 10 busiest stations in CA. In 2012 there were 416,800 rail boardings and alightings in Oakland. The trains running through Oakland are the: Coast Starlight (Los Angeles-Oakland-Seattle) daily, Capitol Corridor (San Jose-Oakland-Sacramento-Auburn) with 7 daily round trips San Jose – Oakland, 15 round trips Oakland-Sacramento (11 on weekends) with one extending to Auburn and San Joaquins (Oakland/Sacramento-Fresno-Bakersfield, with motorcoach connections to Los Angeles): 4 daily trips Bakersfield-Oakland. Capitol Corridor is the third busiest corridor in the country with 1,746,397 riders in 2010, up 2.2% since FY11. San Joaquins is the sixth busiest corridor in the country, had 1,144,61 riders, up 7.2% from FY11.
Amtrak supports strong environmental protection policies. In 2003 it became a charter member of the Chicago Climate Exchange, the world’s first legally-binding integrated greenhouse gas reduction and trading system. The company committed to cut diesel emissions by 6 percent by 2010, “the largest percent of reduction committed to in the U.S. on a voluntary basis and the first by a transportation company.” Riding Amtrak is 14 percent more efficient than domestic airline travel and 31 percent more efficient than auto-travel on a per-passenger-mile basis.
Amtrak supports strong environmental protection policies. In 2003 it became a charter member of the Chicago Climate Exchange, the world’s first legally-binding integrated greenhouse gas reduction and trading system. The company committed to cut diesel emissions by 6 percent by 2010, “the largest percent of reduction committed to in the U.S. on a voluntary basis and the first by a transportation company.” Riding Amtrak is 14 percent more efficient than domestic airline travel and 31 percent more efficient than auto-travel on a per-passenger-mile basis.
AC Transit
Local Bus System [15]
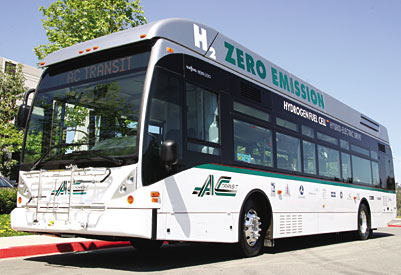
Figure 6: AC Transit Bus.
The system officially began in 1960, taking over the Key System which used buses, horse-drawn rail, electric streetcars and ferries for the previous past 100 years. As of August 2011, the system offered 114 bus lines: 79 local lines within the East Bay, 30 Transbay lines to San Francisco and the peninsula, and 5 All Nighter lines. It maintains approximately 5,600 bus stops, and travels 19.2 million miles annually, with 5,646 service hours daily. According to AC Transit statistics from 2009-2010, the system had an average daily ridership of 200,000 passengers, including 60,000 school children and 14,000 Transbay commuters. Annually this totals to 61.2 million riders, including 711,000 paratransit trips (in accordance with availability under the Americans with Disabilities Act).
The current Alameda-Contra Costa (AC) Transit District is the third-largest public bus system in California, serving 13 cities and adjacent unincorporated areas in Alameda and Contra Costa Counties. The system serves roughly 1.5 million people and covers a 364 square mile area. As suggested by its name, the region includes cities and unincorporated regions of Alameda and Contra Costa counties: Alameda, Albany, Berkeley, El Cerrito, Emeryville, Fremont, Hayward, Newark, Oakland, Piedmont, Richmond, San Leandro, and San Pablo, as well as Ashland, Castro Valley, Cherryland, El Sobrante, Fairview, Kensington, Irvington, North Richmond, and San Lorenzo. AC Transit also enables people to reach downtown San Francisco via the Bay Bridge, and Foster City and San Mateo via the San Mateo Bridge. It has connections to 9 other public and private bus systems, 21 BART stations, 6 Amtrak stations and 3 ferry terminals.
Ownership of the system is supported by the public of the East Bay. The annual operating budget is over $320 million. Funding is only covered 20 percent by fares; all other funding comes from federal, local, regional and state sources. AC Transit employs 1,852 people annually.
According to good urban design practices, AC Transit recognizes the importance of increasing public transport ridership base to limit pollution and traffic, and improve walkability. It has recently taken part in developing local projects supporting public transit in land use. It developed the “Designing with Transit” manual to serve local community agencies.
WORKS CITED_____________________________________________________
- Metropolitan Transportation Comission. Accessed March 6, 2013. http://www.mtc.ca.gov/
- Association of Bay Area Governments. Accessed March 6, 2013. http://www.abag.ca.gov/
- California Department of Transportation. Accessed March 6, 2013. http://www.dot.ca.gov/
- Association of Bay Area Governments, Metropolitan Transportation Commission, Bay Area Area Quality Management District, Bay Conservation and Development. Regional Initiatives: Plan Bay Area. Accessed March 6, 2013. http://onebayarea.org/regional-initiatives/plan-bay-area.html
- Association of Bay Area Governments, Metropolitan Transportation Commission, Bay Area Area Quality Management District, Bay Conservation and Development. One Bay Area. Accessed March 6, 2013. http://www.onebayarea.org/
- Metropolitan Planning Commission. New Bay Area Plan Puts Change in Motion. Accessed March 6, 2013. http://www.mtc.ca.gov/planning/2035_plan/
- Association of Bay Area Governments. Current Facts. Accessed March 6, 2013. http://www.abag.ca.gov/planning/currentfcst/
- California Department of Transportation: The San Francisco-Oakland Bay Bridge Seismic Safety Projects. Bay Bridge History Timeline. Accessed March 6, 2013. http://baybridgeinfo.org/timeline
- Port of Oakland. Accessed March 6, 2013. www.portofoakland.com
- City of Oakland - City Administration: Economic and Workforce Development. International Trade and Logistics. Accessed March 6, 2013. http://www2.oaklandnet.com/Government/o/CityAdministration/d/EconomicDevelopment/s/WFD/DOWD008138
- Port of Oakland. Airport Development Program. Accessed March 6, 2013. http://www.oaklandairport.com/airport_construction_airport_dev_program.shtml
- Port of Oakland. Master Plan Overview. Accessed March 6, 2013. http://www.oaklandairport.com/masterplan_oak/
- Bay Area Rapid Transit District. Celebrating 40 Years of Service 1972-2012: Forty BART Achievements Over the Years. Accessed March 6, 2013. http://www.bart.gov/images/40th/40thFactsheet_v1.pdf
- AMTRAK. Amtrak Fact Sheet, Fiscal Year 2012: State of California. Accessed March 6, 2013. http://www.amtrak.com/pdf/factsheets/CALIFORNIA12.pdf
- AC Transit. Ridership, Bus Fleet and Service. Accessed March 6, 2013. http://www.actransit.org/about-us/facts-and-figures/ridership/
